✅ Tip 8: How to Use Copy Trading Data to Track Top Traders | GetCopyData
How to Use Copy Trading Data Effectively
🔓 Want access to all 12 copy trading tips?
Log in here for FREE or
create your free account »
Why this matters
Most trading platforms like Bybit or Binance only show limited
copy trading data — often capped at 90 or 180 days.
But if you truly want to find a high-quality account to copy, that’s not enough.
You need to know if the trader ever had:
- A major drawdown
- A liquidation event
- Long periods of underperformance
How to Do it
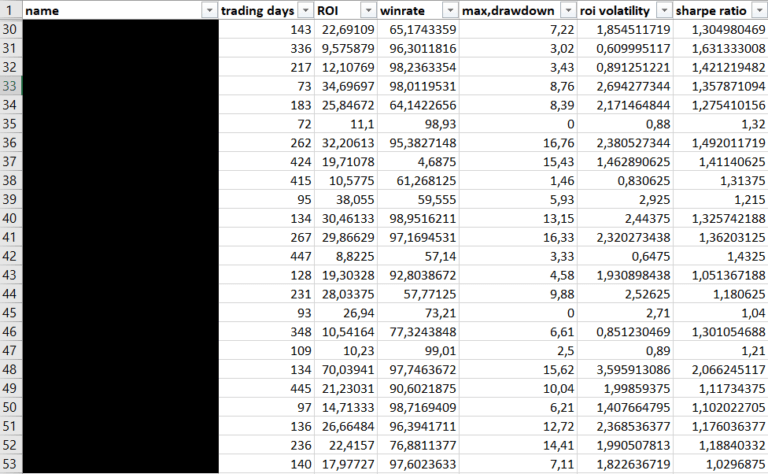
Before following an account, track the data yourself using a simple Google Sheet or Excel file.
We recommend including:
If you have some experience, also add:
- ROI Volatility
- Sharpe Ratio
These are powerful metrics we personally rely on to filter top accounts.
Already following an account?
Make sure to log some actual trades and compare your trade execution (order value) with the master account.
👉 See Tip 7 for how to check this
Ready to earn faster — without doing the work?
Get instant access to historical data from 13,000+ real copy trading accounts, always up to date. Start with the data now → (Pays for itself within 5 days)

This is just a glimpse of the key data we track in Excel — already over 13,000 accounts and counting.
Start building your own copy trading database by tracking the metrics that matter to you.
Just updating it once a week adds 7 new days of valuable insight from Bybit or Binance.
💡 Do this for 2 months, and you’ll already have 150 days of powerful data — a must if you want consistent results.
Why we recommend this?
We’ve learned the hard way — 90% of all insights come from data.
And the other 10%? That’s about understanding your trader’s strategy and trade style.
👉 Check Tip 10 to analyze that side too »
Bonus Tips for Smarter Copying
✔️ If you track 90-day performance, updating your spreadsheet once a week is enough
✔️ Always log the highest drawdown ever seen, not just the most recent
✔️ Starting out?
👉 List the Top 50 accounts that interest you and monitor them — insights will follow fast
erminology (Plain English)
ROI = Your profit as a percentage of the capital you used.
Example: $20 profit from $500 = 4% ROI.
For more information on ROI calculations, check out Investopedia.
AUM (Assets Under Management) = Total capital of all followers combined.
It shows how much money the master is trading on behalf of the followers.
Want to skip manual tracking? Explore our full dataset of 13,000+ real copy trading accounts →
FAQ – Historical Data in Copy Trading
Copy trading data refers to performance stats like ROI, win rate, drawdown and trade history from real trader accounts on popular copy trading platforms. It helps you choose who to follow based on results, not hype.
Tracking this data gives you better insight into risk, consistency, and long-term results. It’s one of the easiest ways to copy with confidence — and avoid costly mistakes.
This is why data-driven copying isn’t optional — it’s essential.
Historical data gives you a reliable view of a trader’s long-term consistency, risk behavior, and drawdown patterns. Instead of relying on one good week, you can see if their performance holds up over months. Copy trading platforms like Bybit and Binance often display performance charts—but GetCopyData offers extended data to go deeper.
While 30-day ROI may show short-term momentum, it’s not enough to assess consistency. At minimum, aim for 90 days. The best traders show stable returns across 90–180 days with low drawdown and few liquidations. Historical performance smooths out anomalies and emotional trading periods on most copy trading platforms.
Important metrics include:
- ROI trend (90d, 180d)
- Drawdown percentage
- Win/loss consistency
- Leverage usage
- Number of liquidations
- Max losing streak
Platforms like Bybit and Binance offer native trader rankings, but often only cover a short timeframe. For full access to extended performance stats and top trader rankings, explore our premium data tools at GetCopyData. These are ideal if you’re serious about evaluating copy trading platforms.
No trading strategy guarantees future profits. But historical data reveals behavioral patterns and risk discipline. A trader with stable, low-risk returns over 180 days is much more likely to perform well than one with high but erratic results. Use history as a guide—not a promise, especially on copy trading platforms where volatility is common.
Because short-term gains are tempting. Many traders follow hype, trending leaders, or traders with flashy 7-day returns. But without historical insight, you're basically guessing. Smart traders use performance history to filter hype from reality — especially on data-limited copy trading platforms.
Why this tip is gold
Most copy traders skip this step — they jump in without knowing the trader’s full history.
But real success in copy trading starts with deep, accurate data.
This tip helps you avoid risky accounts, detect hidden red flags, and build a portfolio that actually grows.
It’s one of the top strategies our users swear by to stay consistent and profitable.
